It is a slow week. Most of my friends are on vacation. I would like to be on vacation with them, but it is not in the cards.
I have taken myself off the road to write the book Metrics That Matter. It is tedious.
Let me just state for the record that “Saying that you are going to write a book, is far more exciting than writing one.” I like to write, but I am 52,000 words into a 90,000 word project, and I am struggling. My mind says write, but my heart says it is spring. I want to garden. I find it easier to write in the winter. For now, I have taped a picture on my desk of the vacation that I want to take in May when the book is finished, and I continue to be head-down … typing away.
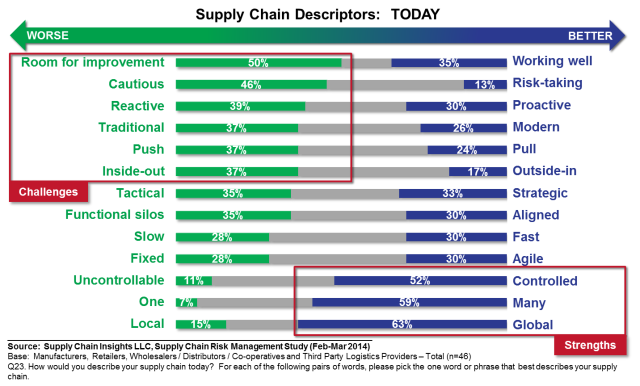
Writing the book is helping me to get perspective. Check out Figure 1. For most companies today there is great room for improvement in the supply chain. It is cautious, reactive and traditional. We have designed it to be that way. Companies want a supply chain that is more aligned and agile. But, guess what? We have not designed it to be that way.
Figure 1. Current State of Supply Chains
Some Stories from the Road
On the 2nd of April, I sat before a board discussing how a company could exceed expectations in the delivery of Return on Invested Capital (ROIC) and superior operating margins and fail at the delivery of customer service and inventory.
On the 9th of April, I went to see a supply chain leader that spoke of how a “tightly integrated” global supply chain was making things worse for him. His demand signal was worse in global markets, especially Brazil. Because he had reduced his buffers—both inventory and manufacturing—and had built a push-based supply chain using a forecasted demand signal, he was failing in many markets.
Last week, I was working with a company that personifies the words cautious and conservative. They have a goal to be agile and aligned; however, their continuous improvement processes are making steady improvement on an efficient supply chain model that is anything but agile or aligned.
As shown in Figure 1, we have built a global, controlled supply chain, but is this want we really want?
Many Ironies.
I see many ironies. There are too many to count. Let me give you a few.
- Companies say that they want to build the end-to-end supply chain from the customer’s customer to the supplier’s supplier, but the investment is primarily in enterprise systems.
- Supply Chain leaders will state in one breath that they want to be innovative and try new technologies; however, in the next sentence, they will ask for a statement of a definitive Return on Investment (ROI) for a project. How can you drive innovation if you hamstring yourself to only take a step to try a project with a definitive ROI?
- New forms of analytics allow us to see demand patterns and translate actual channel demand 10-40X faster, but companies are slow to adopt the techniques.
- As growth has slowed, and global compliance requirements are increasing. Supply chain matters more, but it is understood less and less.
- Nine out of ten companies are stuck at the intersection of operating margin and inventory turns, but they do not know what to do about it.
- Corporate social responsibility and the sustainable supply chain matters. Sixty-five percent of nonrenewable resources lie outside the four walls of the enterprise, but only 21% of companies are actively trying to work with suppliers on the reduction of carbon, water and energy footprints in the extended supply chain.
I Think That the Answer Lies in Leadership.
I encourage all supply chain leaders to have an “oops” day. What is an “oops” day? It is a day for you to have a mea culpa meeting with your team. It is a meeting where you don’t pretend anymore that everything is wonderful. And, where teams don’t prepare pretty charts to tell you everything is glorious. Instead, you book the biggest conference room in the building and invite a cross-functional team to review what happened in 2013.
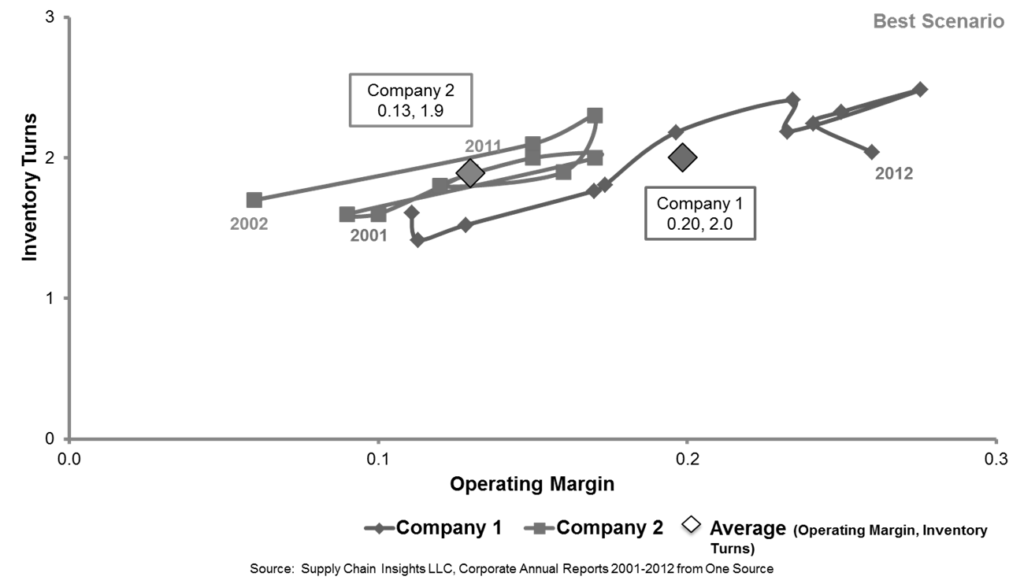
Before the session, ask a small group to chart your progress on the Effective Frontier using orbit charts. Figures 2 and 3 are some examples. Note that on the chart of inventory turns versus operating margin, that one division is making progress while the other has not. In parallel, on customer service, one category is making progress while two are not. This is common.
Figure 2. An Orbit Chart of Performance Comparing Two Divisions within a Company

The issue? The company was doing well on the management of a regional supply chain, but failing in managing products across geographies for a global supply chain. They had not adopted work processes that were more global.
We often find that companies have better performance in the management of regional supply chains where the sources of supply are in the same market versus the management of products across borders. However, when you chart your own progress, you will see your own patterns.
Like most companies that we work with, these lines are not linear. And few show a positive trend. For most companies we work with this is eye-opening. You just do not see the patterns of the interrelationships of metrics in an Excel spreadsheet. And you need to look at the intersections over many years. It is useful to plot these, and then step back and have a dialogue with the greater organization in the meeting.
Figure 3. An Orbit Chart of Customer Service (Case Fill) Versus Inventory Turns

To get ready for your meeting ask each person to write down the number of “oops” moments, or issues, that they felt in 2013.
As part of the meeting, record all of the misses on chart paper and tape them to the wall. (This is why you need a big wall and lots of paper.)
An “oops moment” could be:
- A product sold more than expected. Your team could not meet the customer service goals.
- Product quality issues. The team had reliability issues with a new product or a launch that created problems.
- The product undersold in the market. Your team could not throttle back production fast enough and the company was stuck with product to be written off.
- Employee turnover was high. There was a shortage of planners resulting in a problem.
- The issues go on and on…
- What are the root issues?
- Where are we failing?
- What are we doing well?
- What data is available that we could use to be more responsive?
- Could new forms of analytics help?
- How could we improve outcomes through better work in horizontal processes? (S&OP, revenue management, corporate social responsibility and supplier development)


