 When I started my business in 2012, I frequently wrote about the future using the moniker of Supply Chain 2020. We had just recovered from a recession, and my goal was to help supply chain leaders create a better supply chain by the end of the decade. At that time, Supply Chain 2020 seemed so far away.
A Hard Look at Corporate Performance
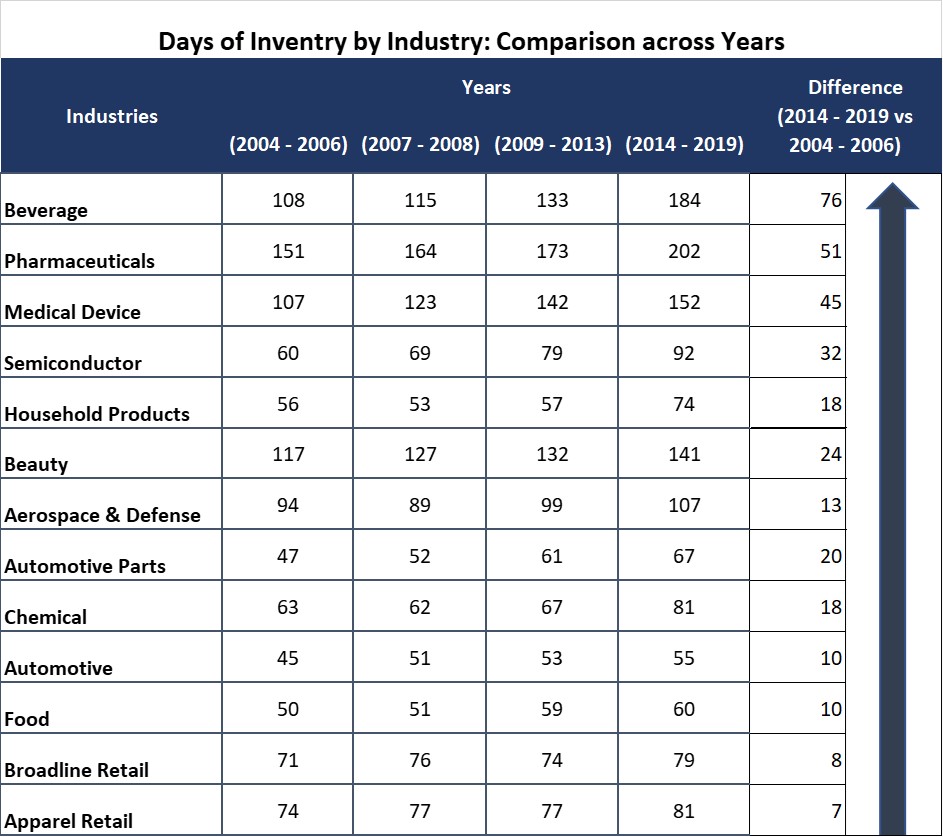
Strangely, in the last decade, while companies had the opportunity to use technology better, supply chain performance declined. Only four percent of companies compared to their peer groups improved balance sheet performance of growth, operating margin, and inventory turns. When compared to pre-recession years, we ended the decade with twenty more days of inventory.
Figure 1. Days of Inventory Comparison

Let me make my point by sharing some financial data using client examples from the last decade. Starting with apparel, let’s compare the two top performers –Nike and VF Corporation. In the orbit chart in Figure 2, you first will notice that both VF is less resilient than Nike and that from 2015 to 2019, Nike outperformed VF. Both companies outperformed their peer groups. However, note that both companies are moving backward at the intersection of operating margin and inventory turns. Their supply chain results in 2019 are worse than in 2015, and this was before the pandemic.
Figure 2. Orbit Chart for VF Corporation and Nike for the Period of 2015-2019 at the Intersection of Operating Margin and Inventory Turns Now, let’s take consumer products. Henkel was recently highlighted for supply chain leadership by Supply Chain Movement in Europe. I like Dirk Holbach and the work that he is doing but note in Figure 3 that while he is making progress on margin, he is losing ground on inventory turns. Henkel is underperforming its peer group.
Figure 3. Orbit Chart for Henkel versus Consumer Non-Durable Industry for the Period of 2010-2019 What can we learn? We need to put the past chapter of supply chain management behind us. Pre-pandemic performance across industries was worse than the performance pre-recession.
My goal in this article is that we need to start this decade by giving science a chance. Let me prove my point through client stories.
Stories From the Road: Let’s Give Science a Chance
Most of my clients implement technology without asking themselves the simple questions of, “What does good look like? And if I am successful, what improves in my business?”
I grow weary of industry doubletalk and over-used superlatives. My experience is that while business leaders use terms like the digital supply chain, end-to-end planning, and Industry 4.0, that they cannot answer these simple questions. Most well-intending projects disintegrate into a sea of enterprise politics. This was the case for the client stories that I will share in this blog. I have changed the names to provide anonymity.
Story 1. Let’s Be Customer Centric
The first story is about a large regional food manufacturer. They are now on their third implementation of supply chain planning. The first in the 1990s was Manugistics, the second in the early 2000s was SAP APO, and now their solution is SAS. The Company is struggling. The demand error is high, and their ability to model is low. They have hired numerous data scientists to help them build custom solutions but to no avail.
The client backcasted in their first implementation, but not in the last two. The SAS forecasting system implemented in 2019 was not tested for model accuracy. (Backcasting is a technique where companies fine-tune models using history. An example for this client would be to use 2017 and 2018 history to forecast 2019. The output of the model would then be compared to the 2019 actuals. The process allows companies to fine-tune models.) So, I asked the questions, “Is your data forecastable? What is the Coefficient of Variation of what you are trying to model?”
When I asked these questions in our Zoom session, the discussion hit a pregnant silence. It was one of those awkward silences where people squirm, and the noise of the clock hand fills the vacuum. So to put the team at ease, I spoke, “Let’s test your demand planning model to see if you can be successful with your current approach.”
It took the team three months to give me the Coefficient of Variation data, but when they did, 90% of the data had a COV greater than 1.5. (Data at this level of variability is complicated to forecast.) The reason? The team was attempting to be customer-centric by modeling an item by customer at a DC level. The problem was that this level of data granularity was not forecastable.
As a result, this client could not be successful with any demand tool with this level of variability. In their attempt to be more customer centric, they were less able to model demand. When they changed their modeling technique, they were far more successful. The answer? Measure the COV of your demand data to understand if the data is forecastable and use this insight to build your demand hierarchies.
Story 2. I Want to Build An End-to-End Supply Chain
The second story is about a regional beverage manufacturer. Historically, the Company was wildly successful with three marquis brands, but its market share was slipping in the past year. In parallel, a fourth product was wildly successful. The Company’s demand planning group was in finance, and the group had little knowledge of the difference between supply chain and financial forecasting. The output of a simple forecasting process using Anaplan over biased the three marquis brands and had a severe under-bias for the new product. The bias for the new product grew worse month-after-month.
The CFO was a wily man with a big ego. Let’s call him George. He was a bit of a control freak and angling for a promotion to COO. George’s stated goal was an “end-to-end supply chain strategy,” but the verbage rambled in a non-sensical cycle of monosyllabic industry slang when asked to define it. In short, his vision of an end-to-end supply chain was transactional: better processing of order-to-cash and procure-to-pay. He was controlling but lacking the understanding of a planning project.
The Company was asset constrained, and he did not recognize the need to manage bias. As a result, the Company was unable to build a feasible supply plan. They were always asking the production team to produce more than was possible.
To make things worse, the Company elongated the tail, adding product flavors to the new brands—this increased demand error. As error increases, there is a need for additional capacity. The companies’ planning was in a vicious cycle where marketing programs were growing increasing error, and the lack of manufacturing modeling made it challenging to see what was feasible. (It takes more capacity as demand error increases.)
The answer? Recognize that the only thing that the financial forecast and the supply chain forecast have in common is the word “forecast.” Start by defining the words forecast and bias. Manage the impact of bias month-to-month and work hard to ensure that it has a feasible supply plan. Educate all of the Georges of the world by getting good at modeling and build asset and inventory strategies based on both bias and error.
Story 3. Help Me Improve Customer Service
The third story is a very profitable global brand with regional supply chain structures. The supply chain team is subservient to manufacturing, with the plant managers believing that they understand supply chain management basics. Each region forecasts an elaborate Sales and Operations Planning process, but since the forecast defines the baseline for bonus incentives, the teams under-forecast ensure that they got their end-of-the-year bonuses. The bonus structures are quite generous.
The problem is that the manufacturing lines are 125% utilized, and there is an ongoing struggle to produce tonnage, much less ship the right product from the production lines to customers based on orders. Ending 2019 with a deduction bill for poor customer service to retailers in the United States of 10 million, the global team asked me to help the team improve customer service.
I rolled up my sleeves to understand the issue. The Forecast Value Added (FVA) of the team was a negative thirty-three percent. Throughout the year, I struggled to help the team understand the baseline of how to measure the demand plan’s success. Getting the forecast better flew in the face of end-of-the-year incentives. The project is ongoing but unsuccessful. There are just too many change management issues. Politics reigns and there is a lack of supply chain leadership to drive a data-driven discussion.
The movement from regional to global supply chains increased corporate politics with few having clear governance. As a result, the need for measurement, data analysis and clear understanding of supply chain strategy increases.
The So What? Let’s Give Science a Chance
Ironically, the stress of the pandemic enables a new chapter for supply chain leaders. It is a time when we can build better. Meeting the market needs of COVID-19 caused organizations to rally, work together, and build a better supply chain through brute force. Executive teams are more involved with discussions on supply chain resilience. It is my hope that we can side-step political discussions demonstrated in my stories and ground the problem solving in scientific methods to understand the properties of data, the potential of supply chains through modeling, and the alignment of metrics.
Figure 4. Relative Importance of Supply Chain Skills
All the best in your journey. Now is the time to build better using new forms of analytics to ground the supply chain in data to unleash the promise of the Art of the Possible. Use data and new metrics systems to free the organization from the ball and chain of corporate politics. Focus the organization on a balanced scorecard while aligning functional metrics to reliability based on data analysis. (An example is not to reward OEE in manufacturing, but to focus on schedule adherence and first pass yield while aligning bonus incentives to customer service and total cost.) My plea? Sidestep politics: give science a chance.)
Your thoughts? I look forward to hearing from you and your team.


