Benchmarking is a measurement of the quality of an organization’s policies, products, programs or strategies against standard measurements. Business Dictionary.com
Writing a Shaman blog post is now a Sunday night ritual. For me, it is a good time to reflect, think and share what I am learning. In my work with Supply Chain Insights, I immerse myself in learning. I continually question my long-held beliefs on supply chain excellence.
I try to make each post interesting, novel and based on research insights. When readers finish a Supply Chain Shaman blog post I want to drive a set of unique takeaways. This is my goal. As a result, in each post I try to take a new angle and hopefully propel industry thinking forward. Today I am going to share five insights that I have gleaned from our work on Supply Chain Planning Benchmarking.
Benchmarking is not Benchmarking
Let’s start with a definition. There are many different meanings/understandings of the term supply chain benchmarking in the industry. A common definition is essential. Like the definition of benchmarking at the top of this post, we believe that the use of an industry standard is essential. Self-reporting of data does not meet this standard.
In most ‘benchmarking activities’, self-reported data is the most common source. However, for elements like forecast error, customer service and slow-moving inventory self-reported data is not sufficient. Why? With the lack of an industry-standard definition, self-reporting is not very useful. It is for this reason that I discount the reporting by APQC, the Institute of Business Forecasting (IBF), and Grocery Manufacturing Association (GMA) benchmarking data. The reason is simple. Each company has a different format and working definition for each of these data elements. While every company will agree that this data is VERY important, the lack of a standard definition precludes comparison. It is for this reason that we asked companies participating in our 2015 Supply Chain Planning Benchmarking to share raw data. We then worked on the analysis.
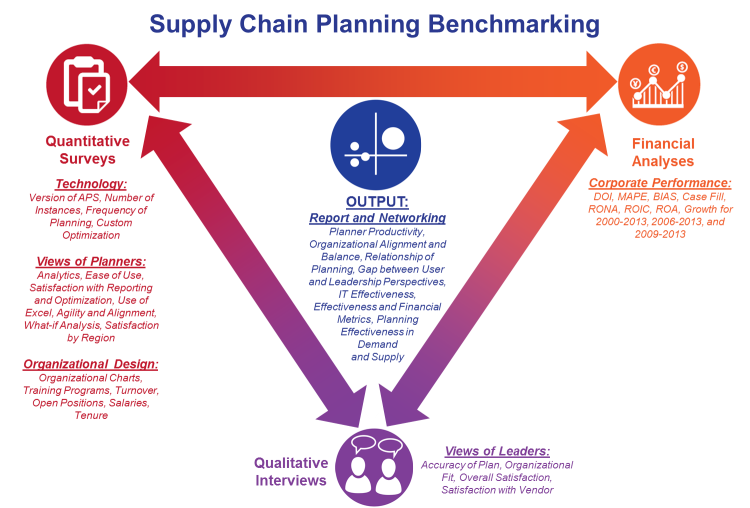
This is our first year of completing a structured benchmarking activity, and it is my goal to broaden this analysis with more industries and companies in 2015. The activity was inductive. We assumed that we did not know what the connection was between the views of supply chain planners, supply chain leaders, financial data, and planning system output (forecast error, bias, inventory targets, and slow-moving inventory). We then augmented the data to understand planner productivity, complexity, and organizational views of planning excellence (comparison of the views of supply chain planners and supply chain leaders). In Figure 1, we outline and give an overview of the methodology.
Figure 1. Supply Chain Planning Benchmarking Methodology Overview

Five Insights. Here I share five insights I have learned from Supply Chain Planning Benchmarking. I am sure that there will be more over the next month, but here are my first “ah-ha!” moments:
1) Planning Productivity Is Grouped within a Tight Cluster Across Companies. A frequent question in today’s times of cost-cutting and process rationalization is, “How many planners do companies need?” We wanted to find out. In the analysis we compared planner productivity by the number of items, by revenue, and by complexity. The answer is similar. As shown in Figure 2, productivity is within a narrow band. For the companies in the study, there is no difference between planning productivity and planning results. With our current systems, companies are at a plateau. They want to improve planning productivity but have not been able to drive effective change.
Figure 2. Planning Productivity

2) Characteristics of Best Forecasters. In our analysis, the best forecasters—companies with the lowest bias and error—have the greatest seasonality. In these organizations, forecasting mattered more than when compared to companies without seasonal patterns. There was a focus on getting it right for a longer period of time. It mattered more to the organization.
3) Forecasting Pitfalls. In our analysis, we see the results of two process pitfalls in forecasting. The first is being able to drive a forecast better than the naive forecast. (The naive forecast assumes that the current month can be forecast using the data of shipments of the prior month as a baseline.) The results against the naive forecast were worse than I expected. Over 30% of the time the forecast error from the forecasting system was worse than if the company had used the naive forecast. For me, this was disappointing to see. This comparison is a good way to measure the effectiveness of forecasting processes.
The second pitfall is the degradation of the forecast from lag 3 to lag 1. A lag is the comparison against points in time. We defined lag 1 as the forecast for the following month (e.g., in the month of July, this would have been the forecast for the month of August) and lag 3 as the forecast for three months out (e.g., in the month of July the three-month lag would be October). The reason for the forecast degradation is the lack of discipline in forecast consensus processes. While many endorse forecast consensus processes, we find that most companies do not have the discipline in place to track and reward the accuracy of management overrides.
Both tests are a great way to measure the effectiveness of demand-planning processes.
4) Best Forecasters Do Not Have the Best Inventory Results. For many years I worked at AMR Research and helped Debra Hofman in her work on supply chain benchmarking. Debra built the Gartner Hierarchy of supply chain metrics. In this work, Debra would take a month of forecasting, inventory, and other supply chain data, and evaluate trends. In this work there were over 85 companies and Debra looked at correlations between the metrics to determine the relationships. In retrospect, after working with the data that we obtained in this benchmarking activity, I have three thoughts:
- Correlation, but no causality? I respect Debra’s work. However, I wonder if there was correlation without causality? The benchmarking was across industries and points in time.
- Noise. After seeing the variation in the same companies’ data for a twelve month period, and the relationship of forecasting and inventory for the period of January-December 2014, I wonder if the data set was complete enough.
- Increase in complexity? The number of items for the companies in the benchmarking set has increased by 35% in the past five years. Has this relationship changed the patterns?
In the work that we just completed, we see that companies in the same peer group for the same period of time may have the best forecast, but not the best inventory results. While the results are not complete, I think that it boils down to the use of the forecast. Companies with a focus on ‘form and focus of inventory’ did better than companies that were only focused on inventory levels.
The forecast is an input in the calculation of safety stock. This is one element of inventory. The form and function of inventory requires the analysis of in-transit inventories, seasonal and new product launch inventories, cycle stock, safety stock and slow and obsolete inventories (SLOB). Companies that did the best on inventory management had a role focused on inventory, clear inventory targets, and were active in the management of the form and function of inventory through network design.
My takeaway? A better forecast does not automatically translate into the improvement of inventory. It is only a starting point.
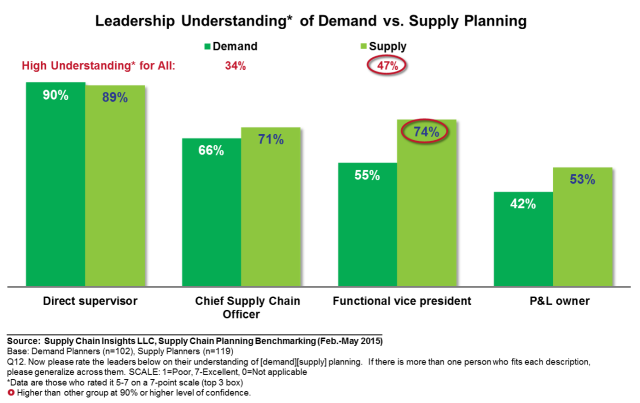
5) Gaps Between Supply Chain Leaders and Planners. In the analysis, we compared the views of 430 supply chain planners in quantitative survey results to 63 qualitative interviews of supply chain leaders. In general, the leaders of organizations rate planning capabilities higher than those of their planners. In addition, the planners believe that the basics of supply chain planning are well-understood by their direct supervisors, but not by their supply chain leaders. Companies with greater alignment ratings and higher ratings of agility have a small gap between these two perspectives.
Supply chain planners, as shown in Figure 3, believe their leaders have a greater understanding of supply than demand.
Figure 3. Supply Chain Planners Views of Supply Chain Leadership Understanding of Supply Chain Planning

In qualitative interviews, all leaders rated their abilities in demand planning as a 5 out of 7, while the average rating of supply planning was a 4. The planner’s evaluation of demand planning effectiveness was lower than supply; however, the variability of planner supply rankings was more variable and contingent upon on industry-specific data model capabilities and “what-if” analysis. My take? Supply is better understood by the traditional manufacturing organization, and the results are more contingent on the technology selection. Demand is less variable, but more poorly understood.
Figure 4. Supply Chain Planner’s View of Planning Effectiveness

____________________
We will continue to share information on this benchmarking effort throughout the month, culminating with a final report in August. If you would like to participate in 2015, let us know.
__________________
Life is busy at Supply Chain Insights. We are working on the completion of our new game—SCI Impact!—for the public training in Philadelphia in August and the content for the Supply Chain Insights  Global Summit in September. Our goal is to help supply chain visionaries, around the world, break the mold and drive higher levels of financial improvement. The conference will feature case studies on supply chain transformation and driving digital transformation. The agenda also includes insights from supply chain leaders on the Supply Chain to Admire analysis and the Supply Chain Insights Benchmarking. We find that companies that have reached better alignment with their financial teams have higher levels of financial results.
About the Author:
 Lora Cecere is the Founder of Supply Chain Insights. She is trying to redefine the industry analyst model to make it friendlier and more useful for supply chain leaders. Lora has written the books Supply Chain Metrics That Matter and Bricks Matter, and is currently working on her third book, Leadership Matters. She also actively blogs on her Supply Chain Insights website, at the Supply Chain Shaman blog, and for Forbes. When not writing or running her company, Lora is training for a triathlon, taking classes for her DBA degree in research, knitting and quilting for her new granddaughter, and doing tendu (s) and Dégagé (s) to dome her feet for pointe work at the ballet barre. Lora thinks that we are never too old to learn or to push an organization harder to improve performance.


