In my recent Mea Culpa post, I mentioned my prior work on Sales and Operations Planning (S&OP), and the importance of leadership. Sounds easy, right? Leadership and S&OP? Shouldn’t it be like peanut butter and jelly? If you have walked in the shoes of the supply chain leader, you are probably laughing by now. What sounds so easy is very difficult.
Background
I have worked with hundreds of organizations over the past twenty years as an analyst to help companies on their journey on Sales and Operations Planning. An analyst never implements. Instead, as an analyst, I work in an advisor role. In the work, I listen to existing processes to provide feedback, ideate with the team on potential improvement, share advice on the fit of technologies, and network leaders to leaders to gain additional insights. I share research, observations, and insights. I like to think that I am a catalyst of sorts to drive improvement.
The more that I see, the more that I understand how companies go so wrong so fast. It usually starts with a project. When a supply chain leader opens a discussion with, “I am leading an initiative for digital transformation”, I know I am in trouble. Or when a CIO states, “We are implementing end-to-end planning to deliver an agile, efficient and responsive supply chain.” I cringe.
I test how much trouble the company is in by gauging the answers to a series of questions:
- How do you define a good plan? What is a good decision?
- In assessing the health of the plan, what do you measure?
- Is your plan feasible? (Did past plans prove valuable?) Were they used?
- How aligned do you believe your organization is to drive these metrics? Who makes the decisions on the trade-offs?
- What is the latency of your order signal to the market? Do you use market drivers to understand market shifts? How much decision latency does your current process introduce?
Observations on What It Takes
In the Mea Culpa post, I wrote that I used to believe that excellence in S&OP was a ratio of 60/30/10. (60% change management, 30% process and 10% technology.) I shared this after interviewing 150 companies on their S&OP processes while at AMR Research. I was honored when I reviewed the finding with Bob Stahl, and he adopted it in his work.
This research, completed in 2006, was during the transformation of multi-national to global supply chains. It preceded the crazy M&A activity in the process industries. For example, in the research, I found maturity in Cadbury, DuPont, and Gilette processes. However, in the churn and burn activity of M&A, these more mature processes were decimated. Kraft was not as mature as Cadbury. The strong DuPont leaders retired. P&G did not appreciate the work Gilette accomplished on form and function of inventory and using market signals.
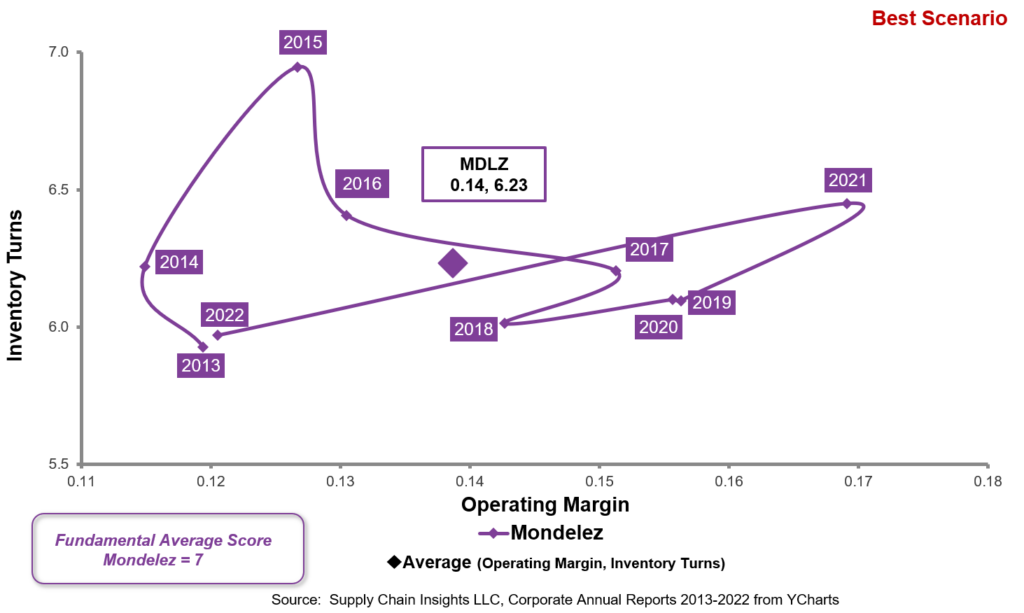
My observation was that Mondelez’s processes were worse than Kraft’s. As a result, the company’s performance at the intersection of margin and inventory turns was circular for the past decade.
I now believe that leadership is 40% of the equation. Leadership must drive change management. So, my new formula is 40/30/20/10. Or simply 40% leadership, 30% change management, 20% process, and 10% technology.
Figure 1. Mondelez Performance at the Intersection of Inventory Turns and Operating Margin
So why do the sentences of digital transformation and end-to-end planning (that I opened the article with) worry me? Success must include technology, but the initiative cannot be technology led. In the case of Mondelez, the initiative was technology led and ignored the prior work by earlier teams.
Leadership: The Right Stuff
So, when it comes to leadership, what is the right stuff? (The scars of experience may show a bit here. So, bear with me.) I believe that the enlighted leader understands that in their role, they need to:
Manages Complexity. One of my favorite case studies was Campbells in 2014. Dave Biegger, then at Campbells, worked with the R&D team to streamline the ingredients for soup. One of my favorite stories was his initiative to reduce the number of cuts of carrots in soups from 33 to three. The results were large, but more importantly, the company’s ability to plan and drive a reliable response improved as complexity improved. Few companies manage complexity effectively.
Supply chain complexity is analogous to cholesterol. Just like there is good and bad cholesterol, there is good and bad complexity. Good complexity drives growth while bad complexity drags expense without improving growth. Bad complexity includes unabated growth in item profiles. (See the World Kitchen case study in the Agility Report.) Demand shifting (the movement of shipments from one period to the next without increasing baseline lift (demand) is a form of bad complexity.
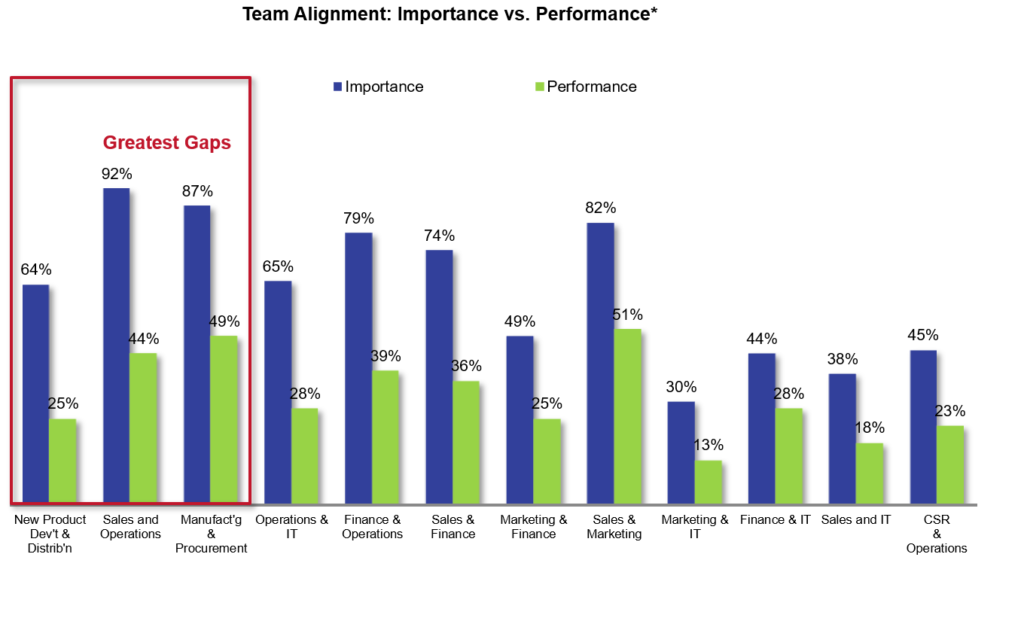
2. Drives Alignment. Alignment issues between sales and operations teams grew three-fold in the last decade. Leaders align metrics and processes to focus on customer service reliability and hold all teams accountable for a balanced scorecard of Growth, Operating Margin, Inventory Turns, Return on Invested Capital (ROIC), and Orders Filled On-time and Complete (OTIF). (The work on the correlation of supply chain metrics to Market Capitalization demonstrates the importance of the management of margin (not costs) against inventory turns.
A good leader knows that cost reductions in the back office does not necessarily improve margins.
3. Clearly Define an Operating Strategy. In today’s organization, only 23% of companies are clear on the definition of the operating strategy. Companies have 5-7 flows within their supply chain that require alignment to the operating strategy. Strategy definition precedes process definition.
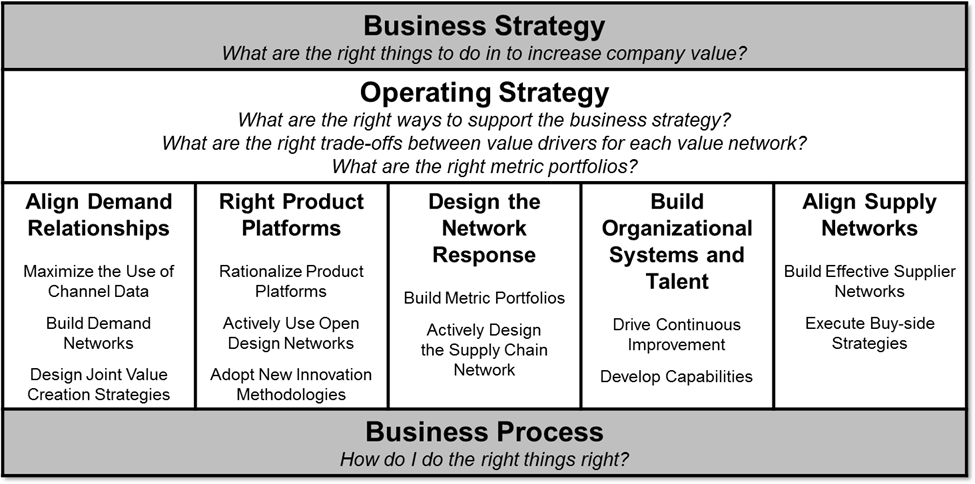
A clear strategy defines what is a good output of a planning system and the governance of who is responsible for the decision.
Measure to Improve Value. One of my favorite podcasts was with Daniel Weber of Beiersdorf. At the time, the Company was privately owned and operated. Daniel was struggling to drive change. Profits were good, and the organization struggled to manage inventory. Daniel convinced the organization to better manage inventory to improve customer service. I like his story of driving commercial and operational team alignment in a tough environment.
Reduce Variability and Latency. As organizations grew and markets became more complex, latency grew. In Project Zebra, during the early days of the pandemic, demand outstripped supply for BSH for kitchen appliances. The market latency was 3-6 months (the time for a shift in a market) to seeing an order. The demand latency (the time of purchase in the channel to the visibility of an order) was 2-12 weeks. However, the process latency associated with the many meetings for S&OP was 2-6 weeks. Each market had its own S&OP. The larger the market, and the greater the complexity, the greater the latency (time to make a decision). Until the study, Michael Huber, leader of the Supply Chain Center of Excellence, had no idea that the current processes led to decisions that were four-to-ten months later than the market. The supply chain was not synchronized. A large factor was the number of meetings and ineffective processes in S&OP.

Wrap-up
I know that there are many “experts” in S&OP. I don’t want to compete. My goal is to drive awareness and help companies drive improvement.
Let me leave you with a story. The year was 2019. A newly appointed CFO at a food company greater than 5B$ in revenue struggled to understand why the organization consistently shorted orders. The teams’ projects were well funded, the organization had many technologies–Blue Yonder, Llamasoft (now Coupa), Power BI, Oracle for Transportation, Tableau, and SAP for ERP. The team frequently spoke at conferences on progress on Sales and Operations Planning (S&OP). A recent project by a large strategic consulting firm for S&OP tightly coupled the budget to the S&OP process as a constraint. Everyone was feeling good about this.
The CFO asked me to take a look. So, I visited the company, and measured the orders shorted and assigned reason codes. This took six weeks. I struggled through a bit of a blame game. A lot of finger pointing. Many in the organization were uncomfortable.
At the end of the eight-month of my project, my finding was that Peter, the CFO, was to blame. How so? The bonus incentives were rich. All of the regional teams (there were thirty-three) wanted to be sure that they made their bonuses, so they sand-bagged volume. The consistent under-forecasting was a barrier to asset investment, and the factories were running at 99.5% capacity.
With the serious under-forecasting, finance consistently rejected the requests for capital investment for many years. No one on the team raised a red flag, realizing that the high asset utilization and the negative bias were a recipe for customer service degradation.
The tight integration of the budget to an asset intensive process with limited capacity resulted in reactivity and loss of capacity. The team did not understand production planning.
So, at the end of the project, I had coffee with Peter. I laughingly shared that he was the problem. He shook his head when he understood the root issues.
Leadership and governance are missing in most of the S&OP processes I observe. I hope that this helps. I welcome your thoughts.
