At the end of a long day of a strategy session on supply chain excellence with a client, I needed to fill up some time in an agenda. To fill the gap, I needed to get creative. The result? Filling in this time gap was the genesis of the River of Demand learning activity. Subsequently, I used the activity in many training sessions with forty manufacturers. Here I share my insights.
Background
Over the last decade, I find fewer and fewer companies understand supply chain planning. While each installed the technology, they are unclear about what drives a good plan.
In helping companies to understand the value, I find that each customer is a bit different in culture and political dynamics but amazingly consistent in their gaps in understanding supply chain planning. The large food manufacturer in the referenced strategy day used a popular technology to forecast monthly using orders as an input. Through a series of meetings to drive consensus, the team degraded the quality of the demand plan by 27%. (In essence, if there was no process or technology, and the company assumed that the last month’s shipments would be the same as the current month, the forecast would be better.) The company had a team of 25 demand planners, spent 10M$ on the roll-out of a planning system, and was being courted by multiple consultants to implement a new demand planning technology. The bad news is that no team member wanted to accept that their planning implementation was making the forecast 27% worse.
Unfamiliar with Forecast Value Added (FVA) concepts, the team lacked the discipline and understanding to drive improvement. The focus was on error minimization, and the WAPE (Weighted Average Percent Error ) calculation gave the team a false sense of reality. In addition, the team did not believe that the system could calculate safety stock as effectively as they could manually (adding to the process latency). So, I was stuck at the end of the strategy day with time to fill with a client that saw no reason to change.
This large food company operated regionally, but the local team had never been in the same room to discuss demand holistically, from sales to procurement.
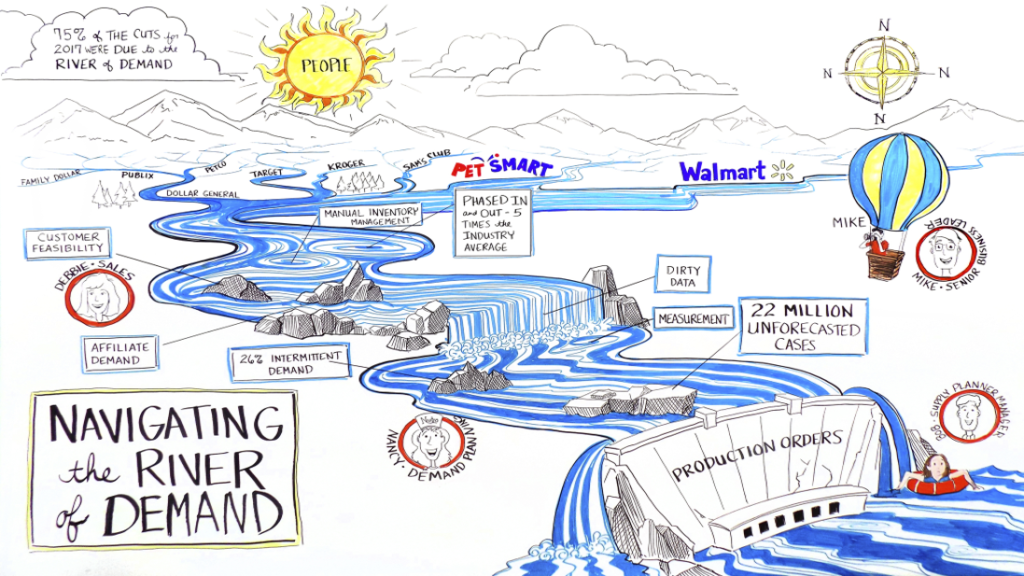
The team consistently under-biased their plans to improve their odds of beating their goals to beat their bonus incentives. The strategy day owner was a global process center of excellence leader. He was not in the room, so as I faced the audience, I was forced to think on my feet and design an activity to help them understand the concepts. To fill the time in the agenda, I developed the River of Demand exercise. The concept is to help team business leaders understand that demand is a flow and that there are multiple demand streams within the organization. Some streams are forecastable, and some are not. Each stream also has a different dynamic–the current changes, and some have dams, eddies, rocks, or sinkholes.
So, I asked for a break and reorganized the room to facilitate my first river of demand exercise. My goal was to help them better understand the problem through storytelling. I show the image created on this strategy day in Figure 1.
Figure 1. Navigating the River of Demand

Surviving Thirty Months of Heightened Variability
The session was pre-pandemic. At that time, people would roll their eyes when I cautioned that historical order demand was a poor proxy for demand in the earlier session. The group felt that the discussion was academic: and not that important. Today, audiences are more open after riding 30 months of the wave-after-wave market disruption, realizing that convention demand planning techniques are inadequate.
I have now done this activity with over forty companies. (We will display the images of the different rivers at the Supply Chain Insights Global Summit and Blaze 2022.) I find them fascinating. In general, current technologies do a bad job of translating demand to supply and helping companies make decisions at the speed of the market.
Let me explain. One of the companies in my training made dishwashers. Their process distorted the demand signal by 49%, and it took the planning teams three months to translate market signals into action for a buy plan or an allocation recommendation. The demand latency from a consumer purchase to a manufacturing order was four weeks. While the team discussed the value proposition of using real-time supply data, they had never thought about the process latency and the inherent order latency in the demand stream.
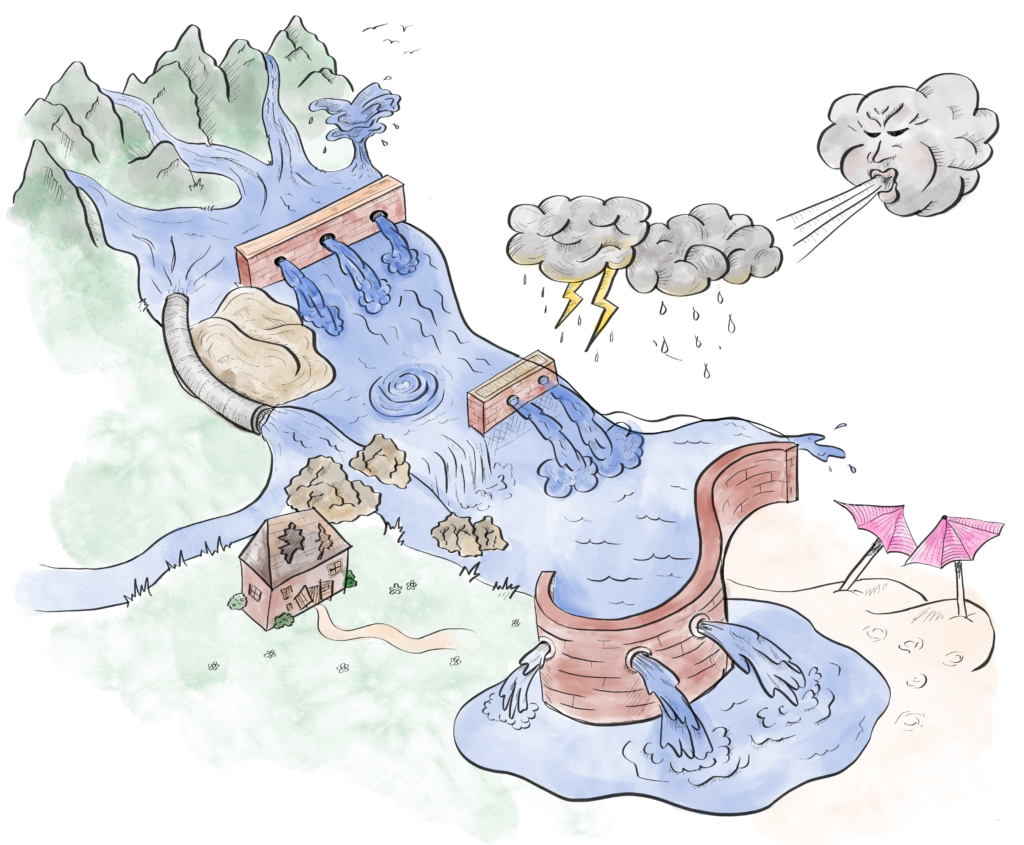
Another example is shown in Figure 2. This image represents the demand for a large food company after multiple years of ERP implementation and over fifteen planning technologies. Note the multiple process dams that add process latency and distort demand. In addition, the company, like most, has a lot of outside-in-demand data that is not used. I encourage you to listen to the planner’s voice in the animation to gain more insights.
Figure 2. Large Food Manufacturer Thinking About Demand As A River

The takeaway?
In redesigning supply chain planning, move from time-phased data to managing demand as a flow. In this transition, we need to:
- Use market data (pilots show that it takes 20-30 market-data indicators to improve the signal. The relative importance of the inputs varies over time and by item.)
- See and respond to market latency by role (measure demand and process latency in the software to help companies make decisions at the speed of the market).
- Measure and use supply variability to drive better outcomes (build a planning master database to feed optimization engines market factors like lead times, conversion rates, and shifts in costs as inputs to supply-side optimization engines in manufacturing, procurement, and transportation.)
- Manage the form and function of inventory (current planning systems manage safety stock but do not allow the user to gain a holistic view of decisions on a procurement buy plan, cycle inventory in manufacturing, and transportation choices on in-transit inventory).
- Build a demand visibility signal to help companies understand and see demand shaping versus shifting and the impact of the bullwhip effect by role (most companies shift demand, increasing costs without improving baseline demand). Production planners and marketing leaders need the capability to understand sales based on consumption data based on an understanding of latency and the effectiveness of demand shifting programs.
How do we do this? The journey starts with unlearning. The current planning approaches do not allow demand visibility by role, and the processes add to process latency and bullwhip distortion. By mapping individual flows, companies can see the issues in process design and begin the journey to improving planning processes.
Join the Guiding Coalition to Improve Planning
If you enjoy our research, please help us by filling out our current survey. We have a week left to get enough respondents to unveil the new results at the Supply Chain Insights Global Summit.
If you cannot make the summit in person, sign-up for the virtual option. We expect to have over fifty business leaders online to gain insights from the pilot results on these new approaches.


