
Pattern recognition is the ability to discern patterns in data and use the insights for further analysis.
Wikipedia
In 2014, I was exploring methods to publish what is now the Supply Chains To Admire report. Fortuitously, I hired a bright summer intern named Alex that introduced me to orbit charts. The use of orbit charts allowed me to see the patterns of performance at the intersection of metrics over time. By charting the performance against peer groups, I could see the story. For the past decade, I have been studying these patterns.
The first step was to find a reliable data set and establish the peer groups. We purchase data from Y charts. (A syndicated data feed used for financial analysts. This data source synchronizes corporate reporting across global markets while tracking restatements, name changes, and currency shifts.) We have archived corporate reporting from Y charts for 1982-2023.
The second step of establishing peer groups was trickier. It took us four years to establish what we believe are representative peer groups based on the performance patterns. We experienced enormous issues with NAICS and SIC codes. To build the peer groups, we asked business leaders to tell us who they thought was a reasonable peer group. There is no perfect methodology, and the peer group discussions continue.
Studying Performance of the Gartner Top 25 Award Winners
Plotting corporate patterns against peer group performance through orbit charts enables a quick understanding of supply chain excellence. Consider Lenovo in Figure 1. Lenovo ranked as # 10 on the Gartner Top 25. As an aside, I do not think that Lenovo is an example of a supply chain excellence. Look at this orbit chart and let me know your feedback.
Figure 1. Year-over-Year Performance of Lenovo Compared to the B2B Technologist Peer Group
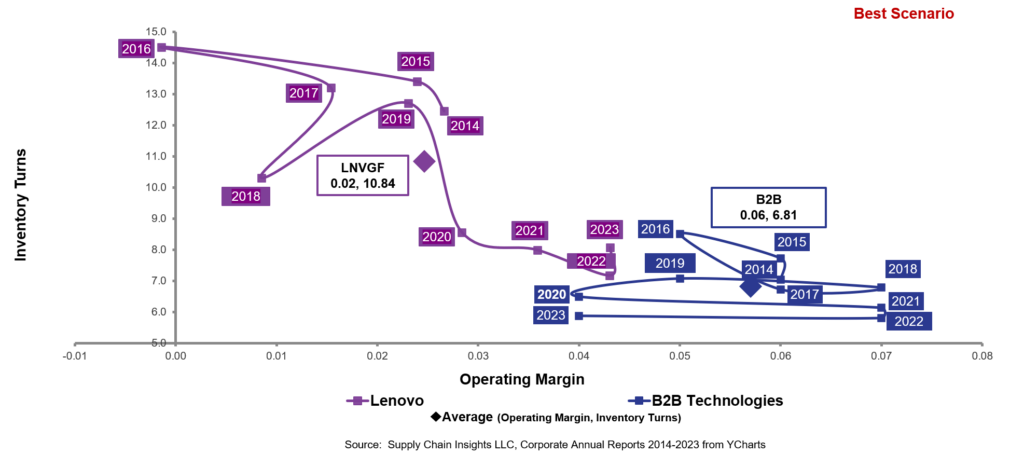
The first part of the story is Lenovo drove considerable improvement in margin in a tough period of 2020-2023, but the company is underperforming the market on margin. Lenovo posts a 2% average margin compared to the industry average of 6%. The second part of the story is that inventory turns for Lenovo are 10.8, but declining.
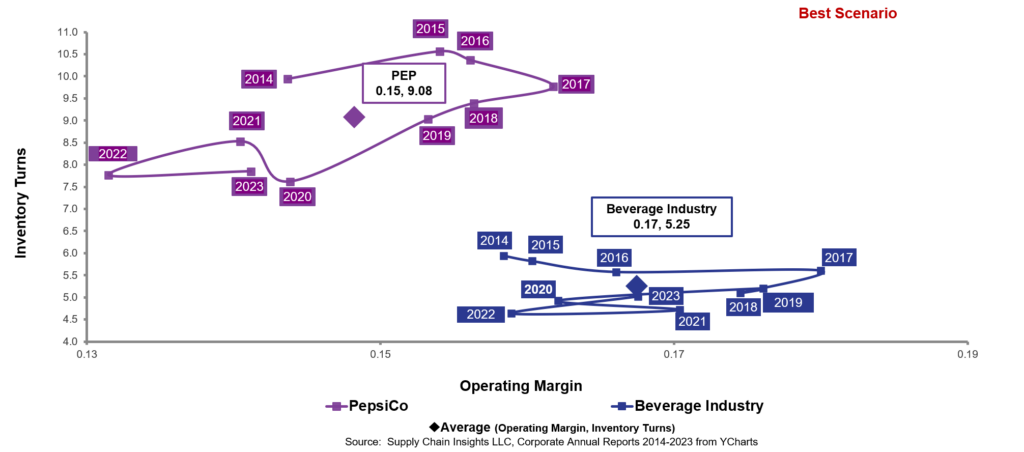
Let’s take a look at PepsiCo. Ranking at #13, PepsiCo outperforms on inventory turns, but performance is declining. The company underperforms on margin.
Figure 2. Performance of PepsiCo Compared to Beverage Peer Group for the Period of 2013-2023
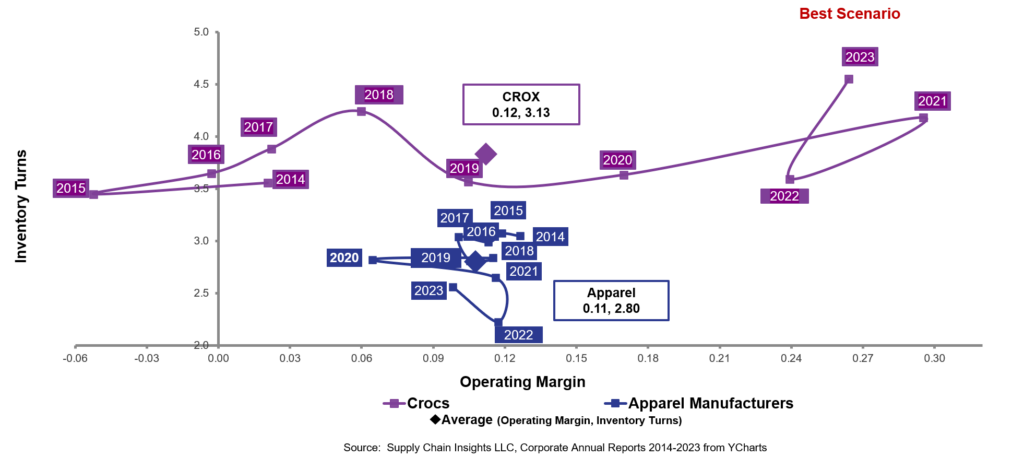
Now let’s compare these patterns to a company driving improvement and outperforming. In Figure 3, we depict Crocs. The Company drove a pattern of improvement year over-year surpassing the industry in the 2019-2020 period. The secret? Innovation in plastic shoe design, and the design of the supply chain to maximize value.
Figure 3. Pattern of Crocs Performance for the Period of 2013-2023 at the Intersection of Operating Margin and Inventory Turns
Wrap-up
I hope that this helps. I hope you find the patterns as useful as I do.
Let us know if you would like for us to chart your company. A useful technique is to chart divisions against the industry peer groups.
If you are in the US, have a great Memorial Day! I will be slinging mulch bags in my garden. I have two pallets to throw over the next two days. Hopefully, I will be able to walk on Tuesday for my client strategy day.