As a research analyst I am studying things which are incredibly difficult to measure. The topics may sound easy, but they are not. In my research I answer questions like:
- Which technology systems drive the greatest satisfaction?
- How satisfied are users with supply chain planning technologies?
- What drives the highest level of satisfaction?
The answer to these questions requires the analysis of many factors. As a student of the social sciences, on this blog I want to continually share insights to drive new levels of thinking. While each technology provider wants the endorsement of their approach, I remain independent. My goal is to share insights from the research.
How Happy Are Planners with Their Software?
In the recent research that we just completed on supply chain planning benchmarking we surveyed 430 planners. The planners in this study work for companies that have deployed (what I consider to be) the most mature demand and supply planning instances in the world. Our goal in this research was to understand user satisfaction and compare it to leadership perspectives. In prior posts I have shared some information on this work. Here, I want to share the planner’s perspective.
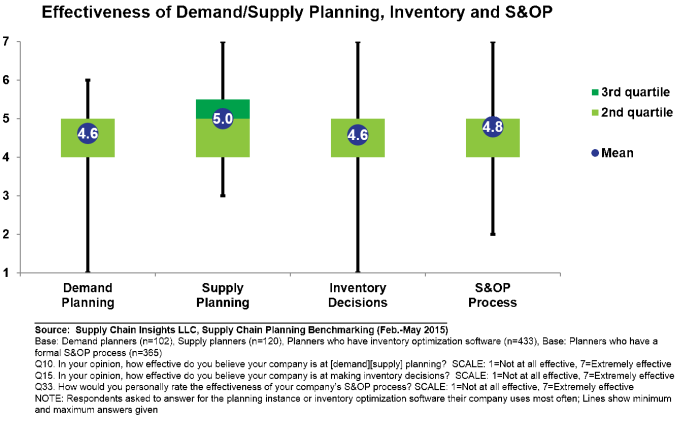
To understand the variance of planner responses, we used an analysis technique termed box and whisker plots. In Figure 1, I share an analysis of user satisfaction of demand, tactical supply, inventory, and Sales and Operations Planning (S&OP) technologies using this technique.
Figure 1. Overall Satisfaction with Planning Solutions

Let’s start with a discussion of how to read the box and whisker plot. The black lines show the entire range of answers; the circle in the middle shows the mean; the bottom and top of the box represent the range of the third quartile; and the band within the box represents the second quartile. For me the story is not about the average; instead, I feel that the research insights lie in data distribution. There are more outliers in the inventory and demand planning responses creating longer ‘whiskers’. However, when we analyze the quartile data, we find that the range of satisfaction is greater for tactical supply planning. The data is skewed for tactical supply planning with companies having higher satisfaction when they rated their capabilities to run “what-if” analysis, the ability to formulate a feasible plan, and the ease of use of the technology higher.
What else do we see in the data? Inventory and S&OP processes and technologies are not as mature—either as technologies or processes—creating longer whiskers. There is less consistency on an industry-standard definition for these processes. In both cases, they are evolving. We also cannot see a statistical pattern in the data at this point in maturity in either inventory or S&OP. We are unable to understand what is driving higher levels of satisfaction. However, when we correlate the planner’s response to the actual inventory, we see companies more mature in inventory analysis to have a lower level of slow and obsolete stock.
Demand planning is mature with a tighter distribution (there are more outliers, but a tighter distribution). Overall, there is lower level of satisfaction with demand planning technologies than supply planning by the planners. It is significant at a 90% confidence level for this data set. While we continue to mine the data, we have not found a set of drivers yet that helps us to understand what improves satisfaction for demand planning. The industry is stuck. Uniformly, planners have a lower level of satisfaction with their solutions.
I find it interesting that demand satisfaction is rated lower than tactical supply by the planners. In interviews of supply chain leaders, conducted in parallel, planning leaders rate demand planning capabilities higher than supply. We believe it is a case of seeing what you understand. The planners in the survey strongly believe that the supply chain leaders have a greater understanding of supply planning than demand. I would agree.
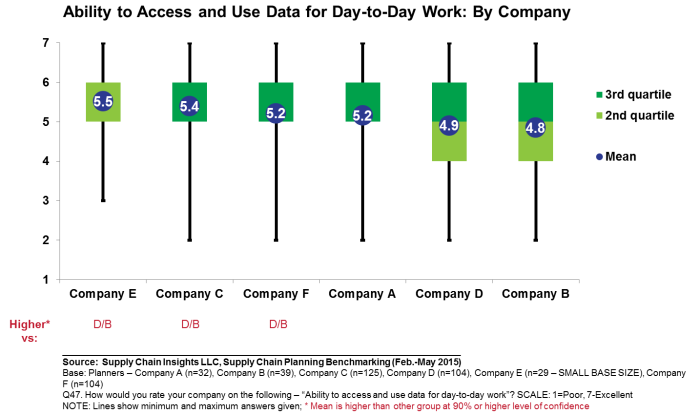
Figure 2. Ability to Get and Use Data for Planning

A second research finding that I find interesting was the planner’s perspective on their ability to get to data. The companies that rated the highest were larger in size, and more mature on the use of analytics. When planners could get to the data they needed they scored significantly higher on the satisfaction of tactical supply planning applications.
My Take
Supply Chain Planning is still evolving. In this data collection, planners rated the applications on a 7-point scale. Demand planning has a narrow band (tighter distribution of responses) and a lower rating. This indicates to me there is a need to redefine this critical application. I think there is a need to rethink the approach. The industry is stuck.
More mature supply implementations had similar characteristics—the ability to get to data, use of “what-if” analysis, and the ability to drive a feasible plan. When this happened, the impact on user satisfaction was significant. The evolution of these capabilities in the technologies over the last decade made a difference.
S&OP and inventory solutions are still in evolution with a wide range of definitions and deployments. It is for this reason, that we are writing on technology capabilities in these two areas. In these two areas, there is more variation between solutions and approaches to solving the problem.
These are my thoughts. I would love to hear from you! And, let us know if there is interest to participate in our benchmarking efforts in 2015.
__________________
Life is busy at Supply Chain Insights. We are working on the completion of our new game—SCI Impact!—for the public training in Philadelphia in August and the content for the Supply Chain Insights  Global Summit in September. Our goal is to help supply chain visionaries around the world break the mold and drive higher levels of financial improvement. The conference will feature case studies on supply chain transformation and driving digital transformation. The agenda also includes insights from supply chain leaders on the Supply Chains to Admire analysis and the Supply Chain Insights Benchmarking. We find that companies which have reached better alignment with their financial teams have higher levels of financial results.
About the Author:
 Lora Cecere is the Founder of Supply Chain Insights. She is trying to redefine the industry analyst model to make it friendlier and more useful for supply chain leaders. Lora has written the books Supply Chain Metrics That Matter and Bricks Matter, and is currently working on her third book, Leadership Matters. She also actively blogs on her Supply Chain Insights website, at the Supply Chain Shaman blog, and for Forbes. When not writing or running her company, Lora is training for a triathlon, taking classes for her DBA degree in research, knitting and quilting for her new granddaughter, and doing tendu (s) and Dégagé (s) to dome her feet for pointe work at the ballet barre. Lora thinks that we are never too old to learn or to push an organization harder to improve performance.


