Daily I see one. You probably also have them in your mail.
What is it? A cute press release ginned-up by an aggressive marketing group at a software company. They are noise hiding the issue that business leaders are struggling in the delivery of business results. Useless dribble. No technology or consulting company holds themselves accountable for the delivery of supply chain excellence. Here are some recent examples.
- Hostess Brands: Sweetest Comeback in Supply Chain History
- Coca-Cola FEMSA Completes Two-Year Supply Chain Transformation Journey
- The Timken Company Bridges the Gap between Supply Chain, Finance, Manufacturing, Sales, and Marketing to Drive Supply Chain Excellence
I am sure that your inbox has many as well. The storyline is consistent. It goes like this: take software X plus an engaged team and deliver great results for a division. The story is the same over the last three decades; but, it leads to a question. Where are the results?
A Historical Perspective
Overall results in business performance on the critical supply chain metrics of growth, operating margin, inventory turns and Return on Invested Capital (ROIC) are declining. How could this be? Supply chain management was defined in 1982. This is not a new topic. Why have we not made more progress in over three decades? ( Keith Oliver, a consultant at Booz Allen Hamilton introduced the term “supply chain management” to the public domain in an interview for the Financial Times.) The focus of the article? Keith postulated the need to connect logistics to business strategy through a new concept termed supply chain management. The need still exists.
Driving Results
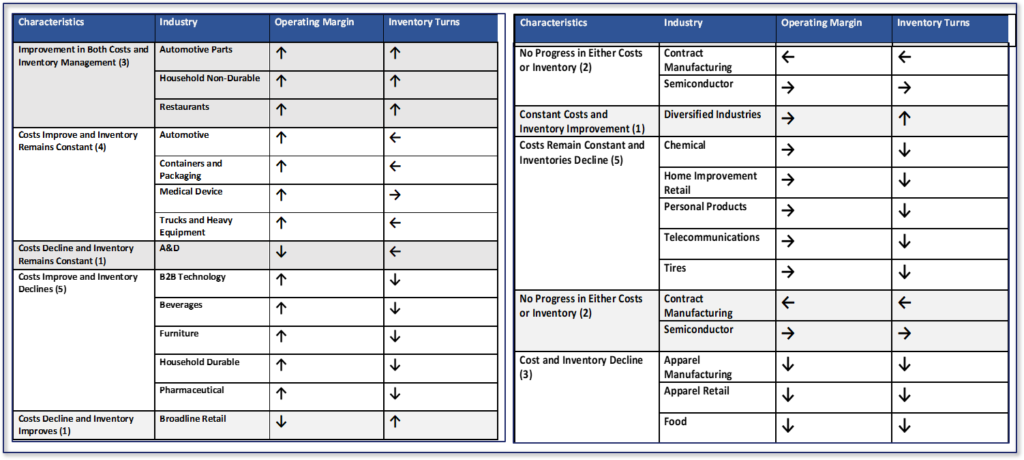
Let’s start with a discussion on inventory. In Table 1, we share the comparison of inventory levels by the industry peer groups pre and post-recession. Despite the investment in technology and whiz-bang approaches, inventory levels today are significantly higher than the pre-recession period. Manufacturers are in worse shape today than 2007.
Table 1. Inventory Levels by Industry Peer Group by Period

To understand the journey on supply chain management, I encourage you to review the orbit charts of the recent Gartner Top 25 Winners. As a heads up, no company in the Gartner Top 25 in 2019 is outperforming their industry peer group while driving improvement. One might wonder why the winning companies are under performing? Good question, but let me leave the answer to that question for another day. Here I want to focus on why companies believe that we have SCM best practices.
Only three industries out of twenty-seven made progress on both cost and inventory. (This analysis is a study in pattern recognition. Performance is a comparison against the mean (minus the outliers) while improvement is a vector analysis of the orbit chart plots for the period of 2010-2018.)
Table 2. Industry Trends from Orbit Chart Analysis 2010-2018
 What Is Supply Chain Excellence?
Let’s start with a discussion on supply chain excellence. In my qualitative interviews with over 500 companies, when I ask for a definition of supply chain excellence, only 1% of executives have a clear answer. Most assume that it is self-evident. They are mistaken. It is not. Business results require active management based on clarity of strategy while aligning policy and tactics to drive business results.
The delivery of supply chain excellence is the result of an inspirational leader working with a team to drive improvement over many years. Progress takes time. Annette Clayton’s vision as a newly minted SVP of Supply Chain in 2009 (now COO for North America) is coming to fruition. Her work, continued by Mourad Tamoud, now Chief Supply Chain Officer, focused on simplification and designing a tailored supply chain response. Despite push back, and the complexity with over one-hundred ERP systems. Annette refused to invest in a large ERP project. Instead, her focus was on building supply chain culture and understanding the customer. In Figure 1, I share the journey while in Figure 2, we share the business results.
Figure 1. Schneider Electric’s Supply Chain Journey
 The results for Schneider Electric, Orbit chart in Figure 2, show improvement. Over time, the company grew margin and is now at the peer group average of 14%. The recent improvement in inventory turns puts the company just under the peer group average for the period of 5.28 turns.
Figure 2. Orbit Chart for Schneider Electric for the Period of 2010-2018 at the Intersection of Inventory Turns and Operating Margin
 Annette brought a keen focus for the customer using tailored supply chains to the company that many would argue was an aging brand. When I teach my boot camp classes, I ask students to draw a supply chain. All attendees start by drawing a factory or a supplier. Sometimes the customer is not even on the drawing. Unfortunately, over the last three decades, we have created a supply-centric culture.
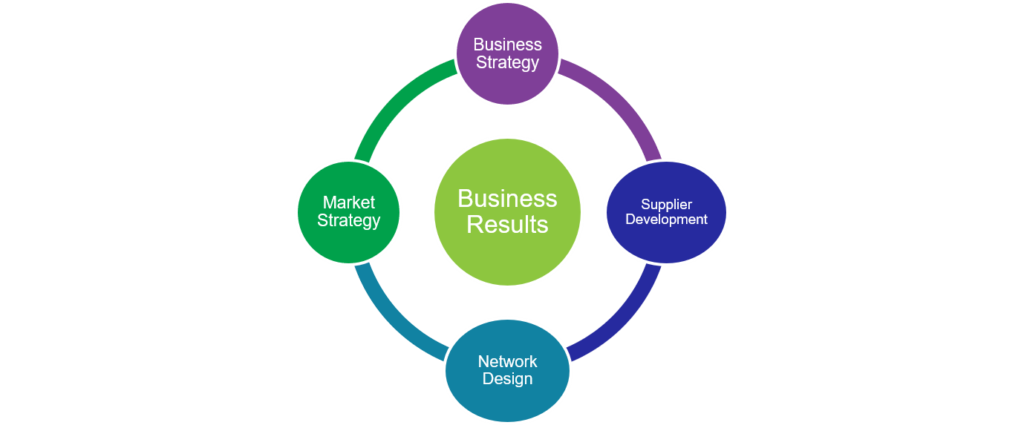
Unlike Annette, the understanding of customer requirements, channel/market tactics and the alignment to business strategies to network design elude companies. There is no alignment, as shown in Figure 3, of business strategy to network design. Market and supplier strategies operate largely in isolation.
Figure 3. Alignment of Strategy to Network Design
 I define supply chain excellence by companies based on five characteristics:
Balanced. The supply chain is a complex, non-linear system. Company metrics are inter-related. Movement in cost or customer service has an impact on inventory. Likewise, there are trade-offs in inventory, cost and customer service with an increase in asset utilization. Each company has a different potential operating on the Effective Frontier balancing growth, customer service, operating margin, inventory turns and Return on Invested Capital (ROIC).
We also cannot peanut-butter the design. Within a company, there are usually five-to-seven different supply chains with very different rhythms and cycles. Each operates on a different effective frontier. Balance occurs when the metrics align with the business strategy. These balanced metrics overlay the functions of source, make and deliver.
Figure 4. The Effective Frontier
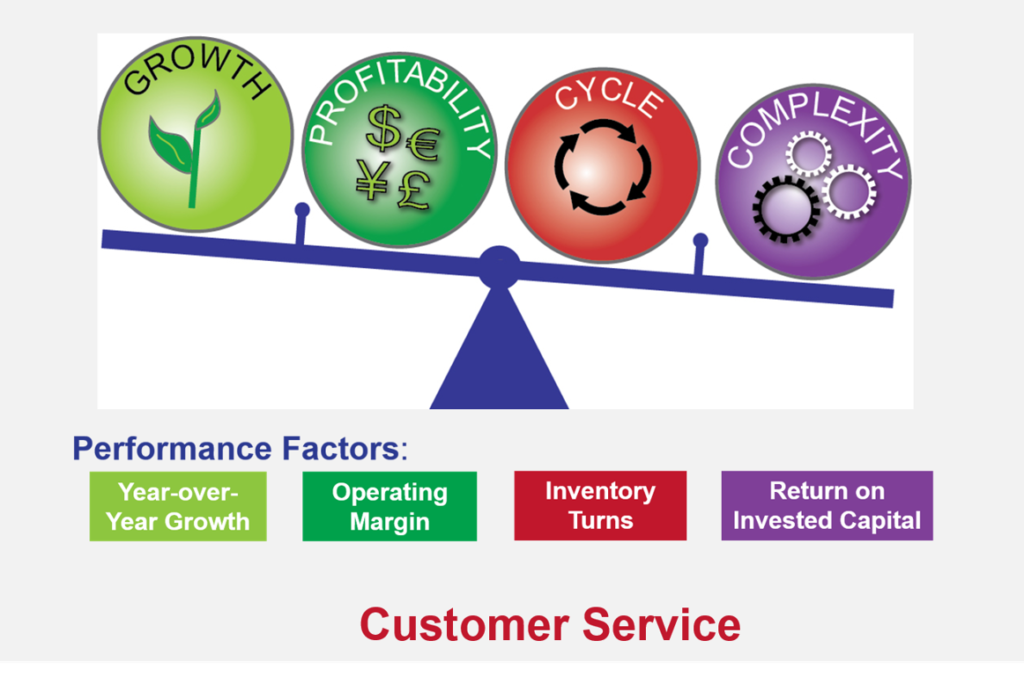
A Focus on Value. In 2012, we worked with Arizona State University to determine which portfolio of metrics most aligned with market capitalization. This is the basis of the effective frontier model shown in Figure 4. In contrast, most organizations focus solely on cost. A focus on any one metric on the effective frontier throws the supply chain out of balance and decreases value as measured by market capitalization or price-to-tangible book.
Driving Continuous Improvement. The best supply chains drive progress on the effective frontier. They are market-driven with the goal of driving the best performance possible.
Resilient. As markets shift—lifecycle shifts, economic changes, and innovation triggers—a well-designed supply chain enables continuous improvement on the Effective Frontier. The patterns are tight and continuously improving. Companies that are not resilient will exhibit wild swings on performance.
Outperforms Peer Group. The best performing supply chains outperform their peer group on the balanced scorecard.
Learning Through Examples
Let me give you some examples.
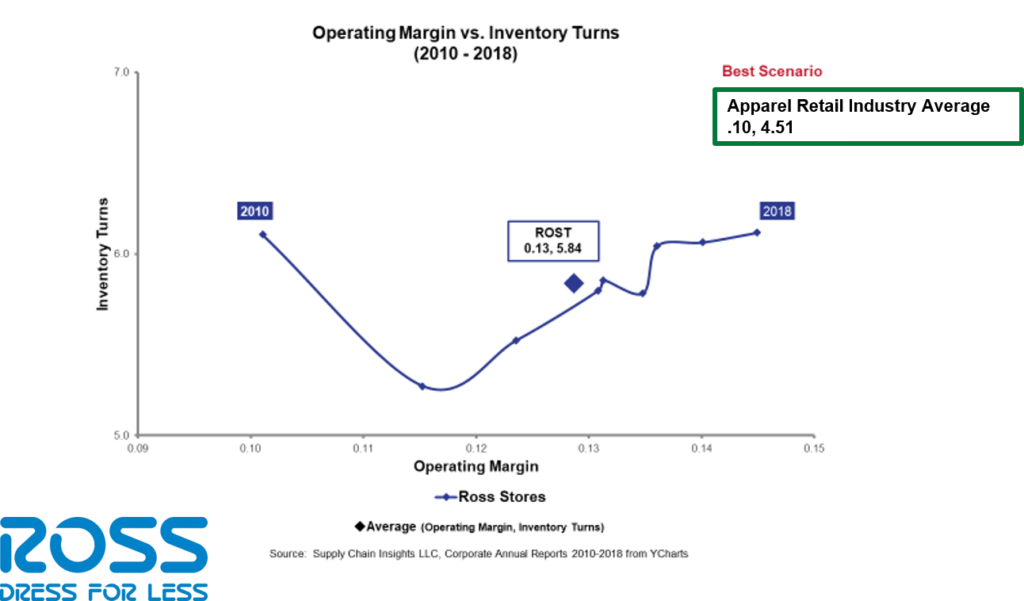
The first is a company that meets all of the criteria for supply chain excellence. Ross Stores is a 2019 Supply Chains to Admire award winner posting better results on improvement and performance for two consecutive years. Retail apparel is a tough industry. Founded in 1982, Ross stores sells high-quality clothing at a discount with a focus on an easy and fun shopping experience. They use purchasing power to deliver discounts. The experience is no frills with a focus on bringing new fashion to the stores quickly.
Figure 5. Ross Stores. A Leader in Performance and Metrics Improvement
An example of two companies (Merck and Novartis) that don’t exhibit improvement, performance or resilience is shown in Figure 6. Note the wild swings in the year-over-year performance and compare the averages for the period of 2010-2018 to the industry averages of 19% operating margin and 2.75 inventory turns.
Figure 6. Merck and Novartis. Out-of-Control Performance
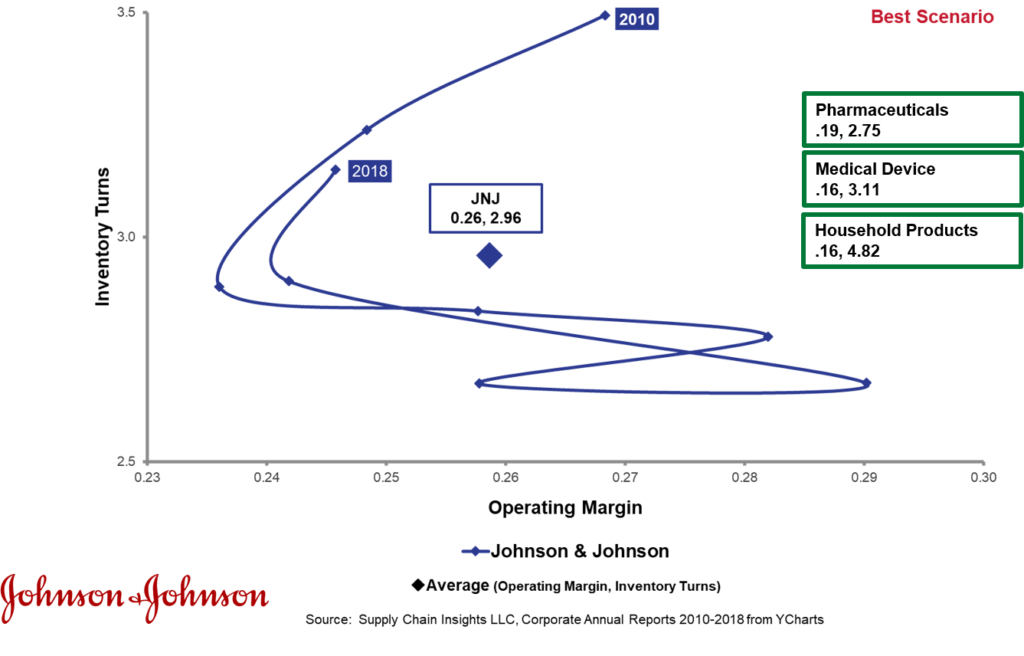
 Some companies are conglomerates like Johnson & Johnson. In this case, the design is different for each sub-segment. The orbit chart shown in Figure 7 for J&J shows the lack of resilience and improvement, but is the company outperforming their industry peer groups? The company has three industry peer groups—consumer, medical device and pharmaceutical. The Company is outperforming the pharmaceutical peer group, but under-performing consumer products and the medical device industry segments. The issue? There are many. Their implementation of SAP APO in Project Mercury produced disappointing results at the end of the recession. With a focus on regional governance, the organization is not able to gain economies of scale in shared services. But, most importantly, the result decline is due to the lack of clear vision and mission.
Figure 7. J&J Moving Backwards in Performance and Under Performing Peer Groups
 Most companies lack improvement, resilience and performance. In Figure 8, we show BASF and Akzo Nobel. For both companies, progress is declining, but Akzo Nobel outperforms the peer group. BASF’s IT-centric approach under Robert Blackburn was detrimental to the firm. The focus on transactional efficiency within organizational silos degraded performance.
Figure 8. BASF and Akzo Nobel Moving Backwards

An example of resiliency is the comparison of the performance of Kraft/Heinz and Smucker’s. Both companies went through major M&A activities in the period of 2010-2018, but note the wild swings in performance for Kraft/Heinz versus the incremental improvement of Smucker’s. Kraft is less resilient, but higher performing than Smucker’s. Which would you rather manage? I think Smucker’s.
Figure 9. Kraft and Smucker’ s
s
What Is the Mission?
What makes a difference? Clarity of the mission.
My father fought with George Patton in War World II. When my dad told me war stories as a small child, there was no lack of clarity of the mission. The goal was clear. He spoke of the drive to cross the Rhine River and overturn Hitler. Clarity of mission was not the case for my friends drafted into the US war effort in Vietnam. One friend was a marine sharp shooter. He hung out in the trees of Cambodia eliminating the Khmer Rouge. He would laugh and say that the commentaries would always comment that the US was not fighting a war in Cambodia, but he knew better.
Today, the mission for most companies in supply chain is not clear. Organizational silos are not aligned.
Last week, on my Linkedin blog post, “Where There is Smoke, There is Fire, ”I shared research documenting that companies choosing SAP APO as the technology for the S&OP business process rated themselves less effective than the general population at a 90% confidence level in 2019. The issue? The lack of modeling capabilities for “what-if analysis” and “model development.” SAP APO clients have a greater dependency on the use of Excel spreadsheets. The article received over 150 comments. It was contentious. In the comment thread, Kathleen responded:
“…there are really no highly skilled and classically trained logisticians in manufacturing which is why IT has been able to dominate and give Business leaders incapable solutions. That is changing. Military logisticians are now retiring and flocking to the manufacturing space and dominating IT with experience and fact-based business requirements that expose all of the destructive solutions that don’t deliver on requirements or business results. As a strategic logistician in manufacturing who has over 20 years of high-level military logistics planning, I would love to partner with you in this area of new research….”
I smiled. My comment? I told Kathleen that without clarity of the mission, success is not possible.
Unfortunately, in the past two decades, companies moved down two erroneous paths: transactional efficiency and financial reengineering. These pushes confused the mission. In the focus on transactional efficiency, business strategy is largely disconnected from tactics and policies.
Transactional Efficiency. Most of the investments in the last decade were on transactional efficiency. Within an organization, companies are not clear on strategy, and there is a lack of alignment of policy and tactics. The tendency is to “peanut butter” the processes within the supply chain by erroneously treating the supply chain as one flow. Annette got it right at Schneider. Simplify, simplify and simplify. Her focus of simplification and recognition of unique supply chain flows is a wonderful case study. We will never get it right by focusing on the lowest level of Figure 10.
Figure 10. Policies, and Tactics Need to Align with Strategy
 The second focus was on financial reengineering. To improve costs, companies chased the low costs of wages, IT outsourcing, elongation of payables and tax efficient supply chains. The companies deploying these tactics show the greatest declines in performance over the eight-year period.
In the last decade, as demand and supply volatility grew exponentially, order latency increased (time from the translation of purchase to an order), product complexity escalated, and global organizational structures complicated decision-making, performance slipped. The continued focus on tight integration of enterprise applications ignored the development of the right tactics, alignment of tactics to policy and the tailoring of the supply chain response. Organizations were not clear on the mission.
In warfare, the mission is the foundation for the activities to determine requirements, develop tactics, and structure/train the fighting force. Here is the mission from Wikipedia on supply chain management:
Supply-chain management, techniques with the aim of coordinating all parts of SC from supplying raw materials to delivering and/or resumption of products, tries to minimize total costs with respect to existing conflicts among the chain partners. An example of these conflicts is the interrelation between the sale department desiring to have higher inventory levels to fulfill demands and the warehouse for which lower inventories are desired to reduce holding costs.
The problem? We aren’t thinking big enough.
Let’s Think Bigger
Let me close with a story. Over the weekend, Bohemian Rhapsody mesmerized me. A little-known fact is that the Shaman loves the songs of Queen. In one of the early scenes, the group was bouncing around in local clubs in a beaten-up van complaining that they would never make it big. In the movie, Freddie Murphy says, “The problem is that we are not thinking big enough. “ He convinces the band members to sell the group’s van to record their first album.
I think that this is the problem here. Bottom line, somewhere over the last three decades, supply chain management lost their way. It became a function within another function operating in isolation. Unfortunately, there are too few Annette’s and too much focus on transactional thinking leading to isolated, functional silos that cannot work together to drive progress.
I look forward to your thoughts. Please share them with the group.
Reference: Oliver, R. K.; Webber, M. D. (1992) [1982]. “Supply-chain management: logistics catches up with a strategy”. In Christopher, M. (ed.). Logistics: Strategic Issues. London: Chapman Hall. pp. 63–75. ISBN 978-0-412-41550-0.
Struggling to Stay Current?
Technology change is moving faster than process innovation. Many companies struggle to keep pace. If this is you, I welcome you to join our upcoming events. Our goal is simple: to build a guiding coalition to drive value in supply chain processes.
We release our annual research on the 2019 Supply Chains to Admire analysis on June 20 th at 1:00 PM. In this research, we analyze over 600 public companies. The focus is to understand which companies are able to drive better performance, while accelerating improvement, than peer group on a balanced scorecard of growth, operating margin, inventory turns and Return on Investment Capital (ROIC). Register for the webinar using this link. (We do monthly complimentary webinars and record them and share them on Linkedin.)

Imagine Supply Chain 2030. Supply Chain Insights Global Summit, September 3rd-6th, 2019, to be held at UI Labs, Chicago, IL. The focus is on Imagining Supply Chain 2030. What is different? The format is unique. The event has no sponsorships, paid speaking sessions or lofty analyst discussions. Designed for extreme networking, I dub this event the unconference. At the event, technologists and business leaders work shoulder-to-shoulder to Imagine Supply Chain 2030. To ensure balance of business and technology leaders, I closed the conference this week to technologists/consultants to ensure the right balance of business and technology leaders. This week, I have added speakers from Dell, Dow, Intel, and Simple Tire. I hope to see you there.
 Network of Networks. This share group is now in its sixth year. We will host our first public events in Antwerp at the Antwerp Management School on November 26th-27th and at UI Labs in Chicago on December 3rd-5th. At this conference, we will focus on the trading partner index (a scoring system for B2B connectivity), definition of quality blockchains and interoperability between supply chain operating networks. (A supply chain operating network is a class of technologies designed to improve data flows between a brand owner and their trading partners. It includes technologies like Ariba, E2open, Exostar, Elemica, and SupplyOn.) The event focus? The agenda shares case study work by members on blockchain, supplier onboarding, and sharing of data.
To register for these events, please contact Regina.denman@supplychaininsights.com.
